TL;DR: Network diagrams go stale because maintaining them manually doesn't scale. The fix isn't updating more often. It's using automated discovery tools that keep diagrams current without human intervention.
Someone spends a Friday afternoon in Visio or draw.io, mapping every device, subnet, and connection. It's beautiful. It's accurate. And within two weeks, someone adds a switch, changes a VLAN, or spins up a VM, and nobody updates the diagram.
Now it's wrong. It'll stay wrong. And six months from now, during an outage at 2am, someone will pull it up, make decisions based on it, and wonder why nothing is working.
This isn't a discipline problem. It's a design problem.
The Diagram You Drew Last Month Is Already Wrong
Even Paessler admits it: "The real difficulty with network topology diagrams is not in creating them - it's in maintaining them."
Networks are dynamic. IT Portal identified the sources of drift that make diagrams go stale: emergency firewall rules, temporary VPNs, one-off routing adjustments, CI/CD pipelines altering infrastructure without documentation updates. They call it "infrastructure drift," and it starts the moment you save that Visio file.
IT Portal also makes a sharper point: the state of your network documentation is an IT maturity indicator. Weak diagrams point to deeper operational gaps.
My own homelab documentation was no different. My network existed entirely in my head, a vague mental model that got fuzzier every time I added another container at 2am. I tried a spreadsheet. I tried a template. Both were wrong within a week.
Why "Just Update It" Doesn't Work
The standard advice is "update your diagram after every change." This advice has existed for 20+ years. It doesn't work. Three reasons:
Nobody owns it. David Cuthbertson, who has spent over 20 years in infrastructure documentation, puts it bluntly: network diagrams are "old, missing, untrusted" across the industry. It's not laziness, it's a management problem. Priorities and resources are set by people who don't update diagrams.
Changes happen faster than updates. Emergency changes at 2am. IaC deployments. A quick VLAN change that'll "just take a second." Each one is too small to stop and update the docs. Multiply that across a team over months and you get a diagram that bears a passing resemblance to your network, at best.
The person who knows the network doesn't need the diagram. The diagram exists for everyone else: the new hire, the MSP taking over, the on-call engineer at 3am. But the person doing the work already has the network in their head. Updating docs is overhead with no personal benefit. Keith Tokash's point on Packet Pushers: the honor system does not work.
Stale Diagrams Cost Outage Minutes, Security Visibility, Bus Factor, and Audit Findings
Outdated diagrams aren't just annoying. They're expensive.
Troubleshooting with wrong maps. Secureworks warns that incident responders working from inaccurate diagrams make decisions on false data. During outages, those wrong decisions cost minutes that matter.
Security blind spots. NetworkTigers found that stale network topology multiplies security risk in two ways: it raises the chance of exposure and increases the damage when something goes wrong. Undocumented paths, forgotten routes, and devices nobody knows about are all invisible on a diagram from six months ago.
The bus factor. When the one person who knows the network leaves, what's left? A diagram that's months out of date, and tribal knowledge that left with them.
Compliance gaps. Auditors want current network diagrams. SecurityMetrics is clear: "current" means it reflects today's network, not that it was created recently.
Automated Discovery Keeps the Diagram Current Without a Maintenance Step
The answer isn't "try harder to update your diagrams." That advice has been published for decades. It doesn't work because the failure mode is human, not technical.
Automated network documentation flips the model. Instead of drawing a diagram and hoping someone maintains it, you let a tool discover the network, map it, and keep the map current with scheduled scans.
What to look for:
- Auto-discovery: SNMP, network scanning, ARP tables. The tool finds devices instead of you listing them.
- Scheduled updates: The map refreshes regularly so drift doesn't accumulate.
- Intuitive visualization: Not just a device list. An interactive map showing how things connect, that anyone can quickly get up to speed on.
- Shareable output: The whole team should benefit without everyone needing a login or a license.
If you want to see how the options stack up on those criteria, we put together a network documentation tools comparison covering discovery method, live updates, and list pricing.
We built Scanopy because we had this exact problem. Deploy a lightweight daemon on your network, point it at your subnets, and it discovers devices, maps connections via SNMP, and generates a topology map that updates itself on every scan. It detects over 200 services automatically. New device shows up? It's on the next map.
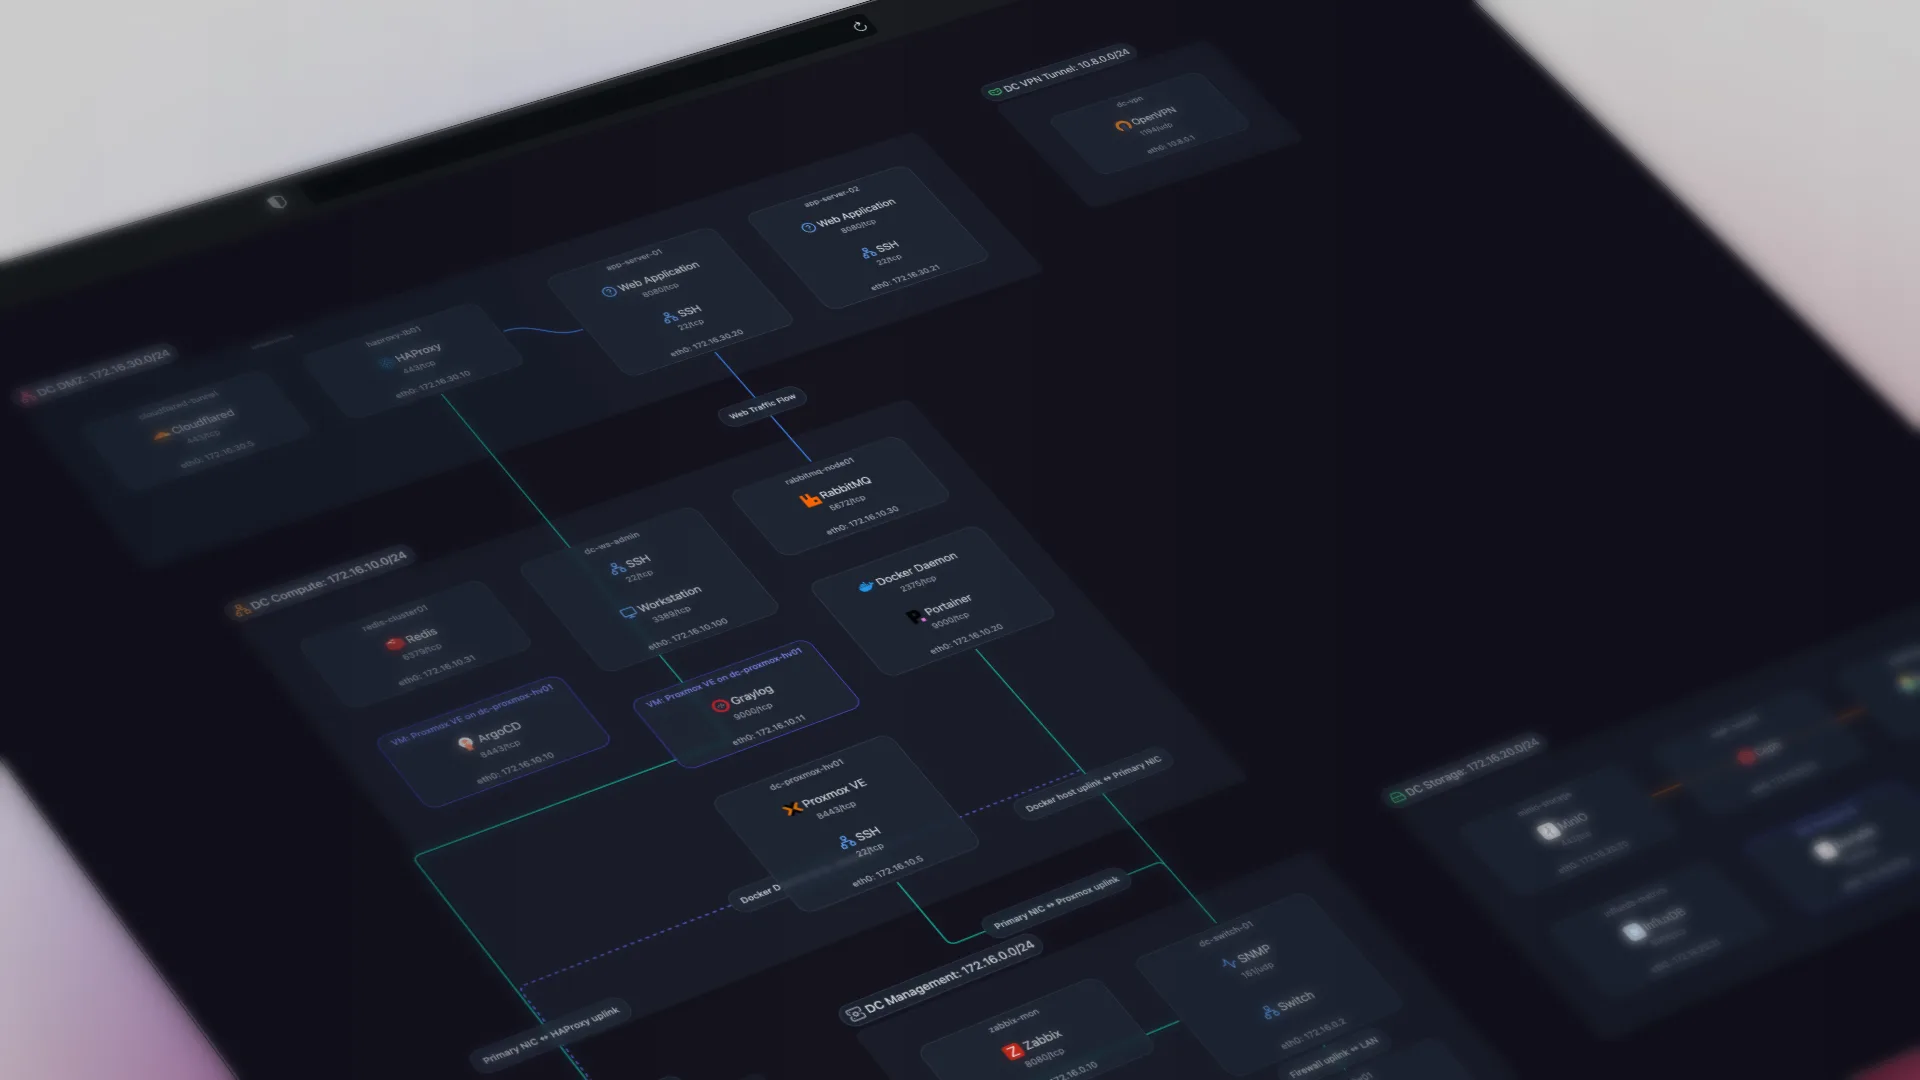
Here's what that looks like in practice; this is a live Scanopy map you can interact with:
That embed isn't a screenshot. It's a live, interactive map. Scanopy maps are embeddable anywhere that supports iframes: your wiki, your internal docs, your runbooks. You can also hand someone a read-only share link to the live map, or take a frozen export (PNG, SVG, PDF, HTML, Mermaid, Confluence, CSV) when you need a snapshot. Embed the map once, and every place that references your network topology stays current automatically. No re-exporting PNGs, no copy-pasting updated diagrams into twelve different Confluence pages. The embed always reflects the latest scan.
Compare that to a Visio file saved to SharePoint six months ago.
Brandon Lee at VirtualizationHowTo put Scanopy through its paces on a production network and came to the same conclusion: manual diagrams don't survive contact with a real environment.
Design Tools Plan What Should Exist. Discovery Documents What Does.
Manual diagramming tools solve a different problem.
- Planning and design. You're designing a network that doesn't exist yet. Automation can't discover what isn't there. Visio and draw.io are great for this.
- Compliance docs with specific formats. Some audits require particular layouts. Use automation as the data source and templates for the format.
The distinction: design tools vs documentation tools. draw.io is great for designing what should exist. Automation is for documenting what does exist. They solve different problems, and they can coexist.
Frequently Asked Questions
Why do network diagrams get out of date so quickly?
Networks change constantly and diagrams do not update themselves. Emergency firewall rules, temporary VPNs, one-off routing changes, and IaC deployments all cause infrastructure drift the moment you save a Visio file. Each change is too small to stop and document, but they accumulate until the diagram bears only a passing resemblance to the real network.
How do I keep network diagrams up to date?
Stop relying on manual updates and use automated discovery. A tool that scans the network via SNMP, ARP tables, and network scanning finds devices for you and refreshes the map on a schedule, so drift never accumulates. The failure mode of stale diagrams is human, not technical, so the durable fix is removing the manual maintenance step rather than trying harder.
Why doesn't updating the diagram after every change work?
Three reasons. Nobody truly owns the diagram, so it becomes untrusted over time. Changes happen faster than updates, especially emergency and automated ones. And the person who knows the network already has it in their head, so updating docs is pure overhead with no personal benefit. This advice has existed for over twenty years and still fails.
What do stale network diagrams actually cost?
They slow troubleshooting, because responders make decisions from false data during outages. They create security blind spots, since undocumented paths and forgotten devices are invisible on an old map. They raise the bus factor when the person who knows the network leaves. And they cause compliance gaps, because auditors expect diagrams that reflect today's network.
Can automated network diagrams replace Visio or draw.io?
For documenting a live network, yes; for designing one, no. Automation can only discover what already exists, so Visio and draw.io remain the right tools for planning a network that is not built yet or for producing a specific audit layout. The clean split is design tools for what should exist and documentation tools for what does exist.
What should I look for in a tool that keeps diagrams current?
Four things: auto-discovery via SNMP, scanning, and ARP tables so the tool finds devices instead of you listing them; scheduled updates so drift does not accumulate; intuitive, interactive visualization rather than a plain device list; and shareable output so the whole team benefits without everyone needing a login. Scanopy was built around these criteria.
Started as a homelabber, now deep in SNMP MIBs, Layer 3 topology, and service fingerprinting - building the network documentation tool I wished existed.