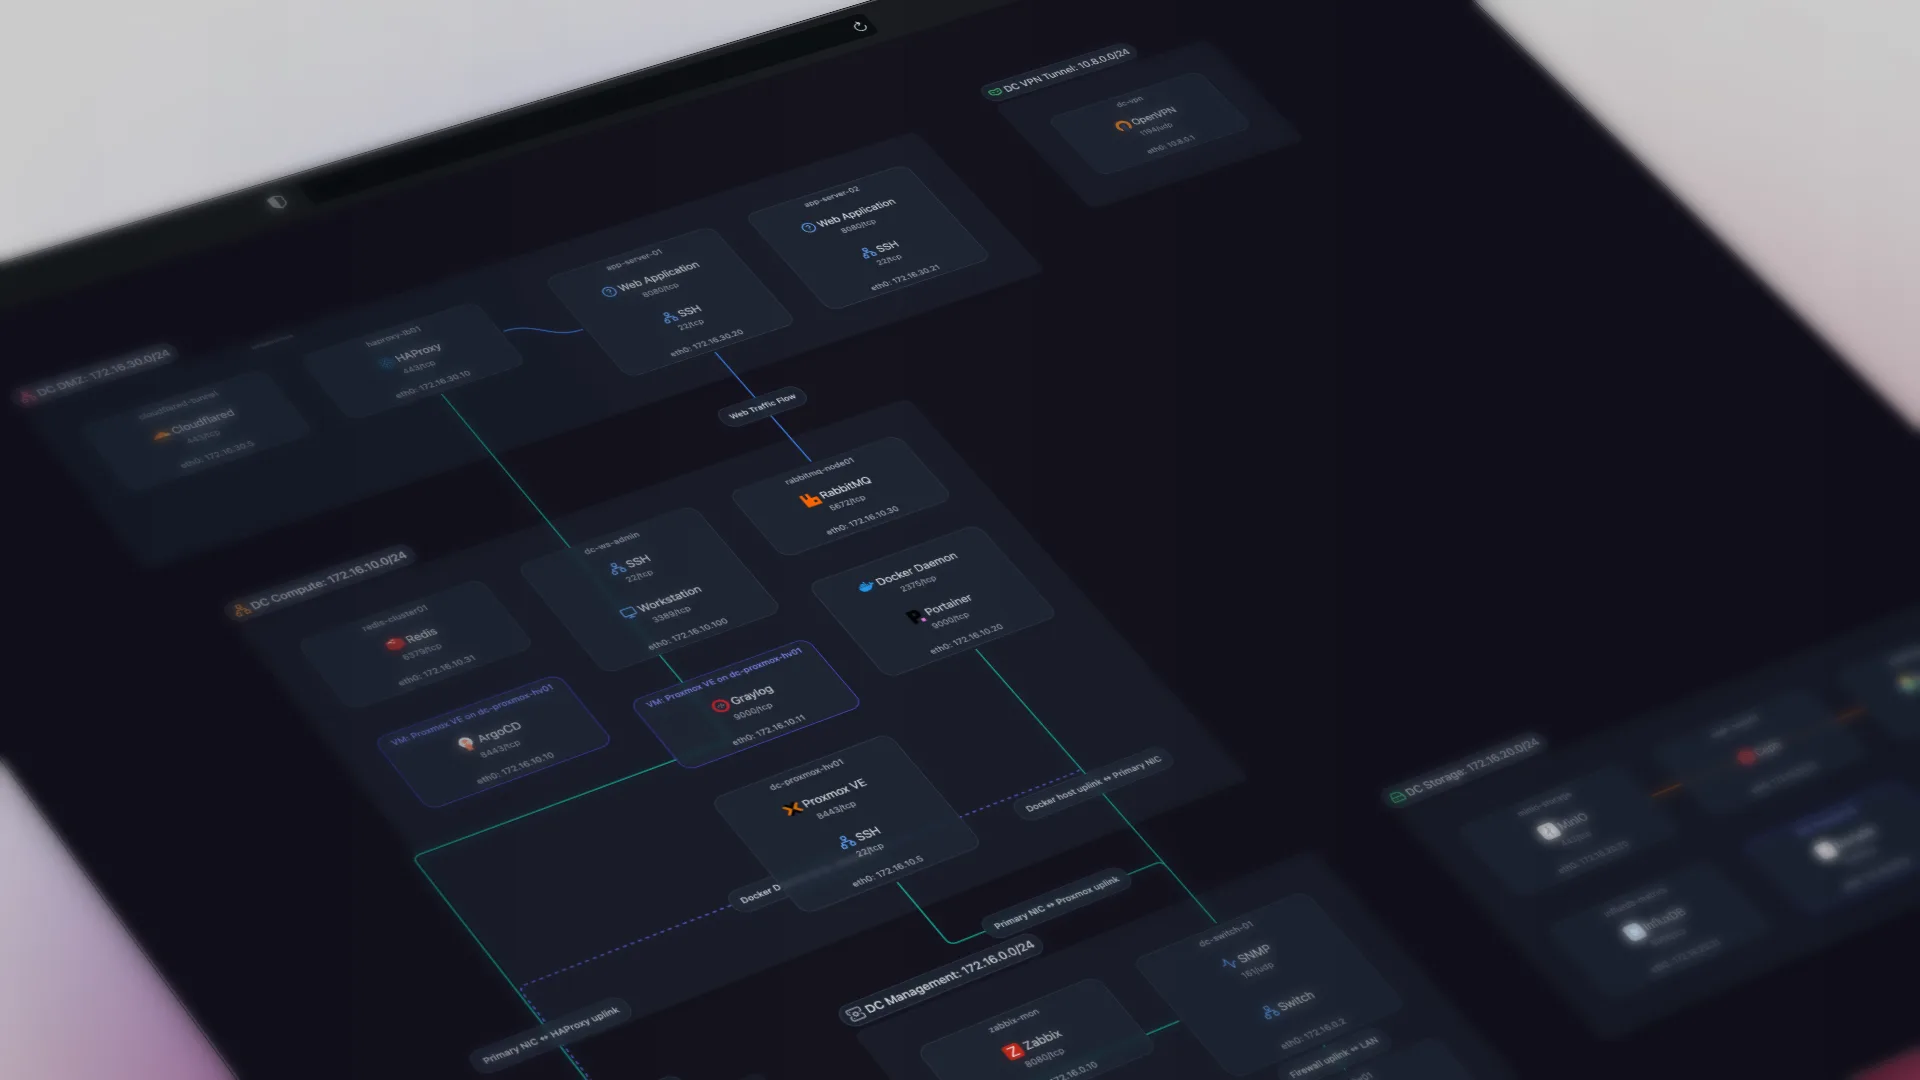
Scanopy is for IT teams and MSPs who want a dedicated network diagram automation tool which works alongside their existing monitoring platform. ManageEngine OpManager is for mid-market IT teams that want monitoring and visualization at a lower per-device cost. Discovery, the four topology views, pricing, and licensing are where the two differ.
Scanopy vs ManageEngine OpManager: head to head
| Scanopy | ManageEngine OpManager | |
|---|---|---|
| DiscoveryProtocols used to find devices and map connections | SNMP LLDP CDP ARP TCP/UDP | SNMP CDP LLDP ARP [8] |
| ServicesNo No service awareness Basic Common port detection Yes Application-level fingerprinting | Yes240+ types | No |
| Network ViewsWhich topology views the tool produces from discovery. L2 Physical switch ports and links L3 Subnets, VLANs, routing Workload VM/container host nesting Application Service-dependency / app grouping Yes supported Tag ? unverified Greyed not supported | ||
| Live UpdatesWhether diagrams update automatically after the initial scan | Yes | Yes |
| Open SourceOSI OSI-approved open source license Source available Source code available, restricted license No Proprietary | OSI AGPL-3.0 | No |
| PricingStarting price or pricing model | Starts at $11.99 monthly, unlimited hosts | From $95/yr (10 devices) [9] |
| Also IncludesCapabilities beyond network diagramming | Docker Visualization | Monitoring |
How they compare
OpManager and Scanopy overlap more than most pairings on this list. Both auto-discover L2 and L3 topology over SNMP, CDP, LLDP, and ARP, and both produce a workload view: OpManager maps host-to-VM, VM-to-datastore, and host-to-network relationships through its virtualization maps, which matches Scanopy's workload view. The difference is the category. OpManager is a full monitoring platform that also renders rack and floor-plan views, which most monitoring tools do not. Scanopy is a dedicated documentation tool with per-host service fingerprinting and no monitoring, alerting, or polling.
The trade-off is platform versus focus, and price. OpManager is self-hosted on Windows or Linux, is cheap (from about $95/year for 10 devices), scales to tens of thousands of devices, and bundles monitoring you may want anyway. Scanopy is flat monthly with unlimited hosts, self-hostable under a commercial license or free under AGPL-3.0, and adds an application-dependency view OpManager doesn't have. If you want monitoring plus built-in visualization at a low per-device cost, OpManager bundles both. If you want documentation that's independent of your monitoring stack, plus an application view, Scanopy runs alongside it. Monitor with OpManager, document with Scanopy.
OpManager also renders L2, L3, and the workload (host-to-VM) view, and it adds rack and floor-plan views that Scanopy does not produce. Scanopy adds the application-dependency view and per-host service fingerprinting. OpManager has no application-grouping map.
When to choose which
Choose Scanopy when: Choose Scanopy for documentation tool over monitoring platform: automatic L2, L3, workload, and application views, per-host service detection, flat pricing regardless of host count, and a free, self-hostable Community edition. It sits alongside your monitoring stack rather than replacing it.
Choose ManageEngine OpManager when: Mid-market teams that want monitoring and visualization in one tool at a lower per-device cost than Auvik. OpManager also renders rack and floor-plan views, which most monitoring tools do not.
This is a focused, two-tool comparison.Weighing other options too? See the best ManageEngine OpManager alternatives. For all 13 tools side by side, see the full network documentation tools comparison.
Sources
Started as a homelabber, now deep in SNMP MIBs, Layer 3 topology, and service fingerprinting - building the network documentation tool I wished existed.